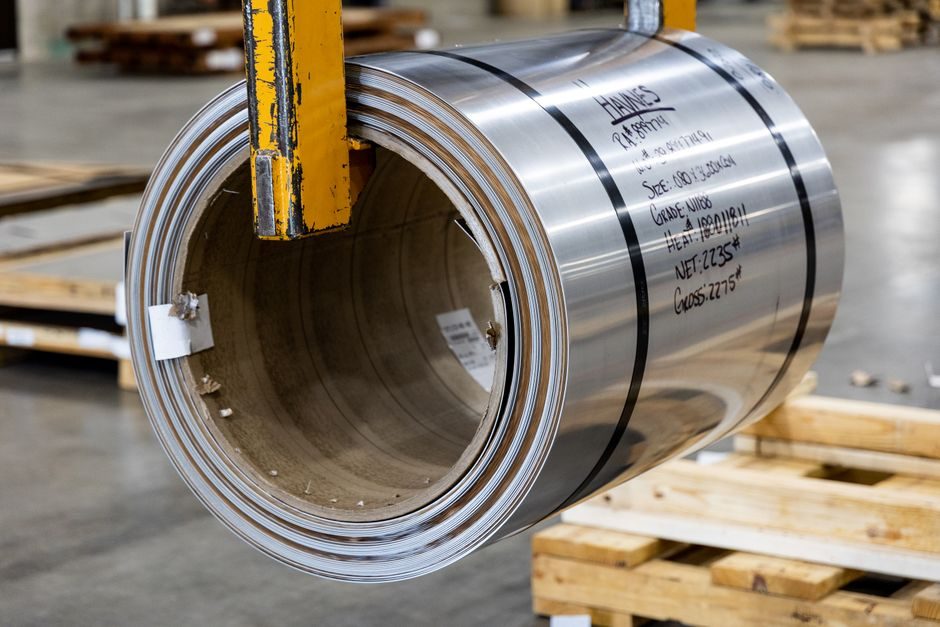
Global Energy Monitor's Global Iron and Steel Tracker (GIST) records an annual crude steel capacity of 3.7 billion tonnes across iron and steel plants it actively tracks, with country-by-country technology and ownership data exposed through an open dashboard [S5].
China is the single largest contributor to that capacity base. Chinese crude steel production was projected to grow 6.5% in 2019 to 988 million tonnes even as headline GDP slowed [S1], a baseline figure that anchors the long-run capacity scale procurement teams still reference when sizing mill-slot allocations and carbon steel sourcing windows. The country also continues to operate the world's largest state-owned mills, including the Anshan complex in Liaoning — founded 1949 and historically shipping flat-rolled and rail product to Japan, the United States, Canada and India [S2].
Capacity Distribution Across Major Producing Countries
The 3.7 billion-tonne capacity base tracked by GIST covers iron and steel plants across 3.7B tonnes of installed annual crude steel capacity, with country-level technology pathways (BF-BOF, DRI-EAF, EAF-only) and ownership (state vs private) mapped per asset [S5]. China dominates BF-BOF output, India runs the second-largest installed base and is DRI-EAF heavy, while Japan, South Korea, the United States, Russia, Turkey, Germany and Brazil round out the next tier.
Outside the top tier, the global cast-product segment — closely tied to plate, structural and alloy steel output — was valued at US$149.4 billion in 2022 and is projected to reach US$218.6 billion by 2031 at a 4.3% CAGR, driven by infrastructure investment in populous countries such as China and India [S6].
Supply-Side Reform and Capacity Discipline
Capacity discipline remains a recurring policy lever. In 2017 China's central state-owned enterprises pledged to cut roughly 5.95 million metric tons of steel capacity and 24.73 million tons of coal capacity, with China Huaneng Group alone considering 9.14 million tons of coal cuts as part of the supply-side structural reform [S3].
That policy direction interacts with downstream demand for stainless and electrical grades covered in the stainless steel and silicon steel pages: when BF-BOF slots are idled, EAF-based stainless and grain-oriented silicon sheet output can rebalance, but lead times for transformer and motor laminations typically widen by 4-8 weeks because the latter rely on tightly constrained hot-strip mill windows.
Country-by-Country Comparison on Decision Criteria
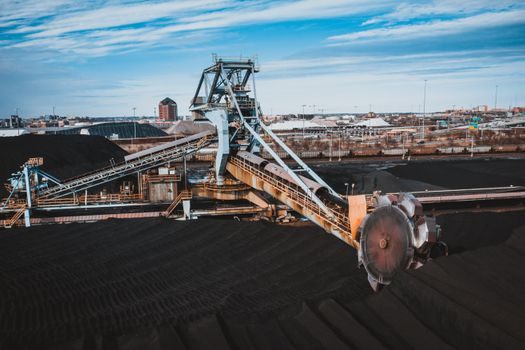
For procurement teams, the four criteria that matter most are output scale, technology mix, export posture and policy risk. The table below lines the main national bases up against those criteria, drawing on the GIST dataset [S5] and the historical baselines [S1][S2][S3].
China scores highest on output scale (≈1 billion tonnes annual crude production [S1]) and full-stack grade coverage, but policy-risk events such as the 5.95 Mt central-SOE capacity cut [S3] and ongoing decarbonisation mandates can swing domestic mill slot availability quarter to quarter. India ranks second on installed capacity, runs a DRI-EAF-heavy mix suited to long products and rebar, and ships growing tonnages of semi-finished steel. Japan and South Korea are export-anchored, dominated by integrated BF-BOF assets with deep ties to automotive and shipbuilding buyers. Russia, Turkey, Germany and the United States round out the top ten, with the US skewed toward EAF flat-rolled and remelt stainless capacity.
Failure Modes and Sourcing Constraints
The dominant failure mode in this category is not absolute capacity shortage but mismatched grade-versus-mill availability. A buyer needing stainless steel cold-rolled coil in 304/316 cannot substitute a Chinese carbon-steel hot-rolled slot, and a buyer needing grain-oriented silicon steel cannot substitute a non-oriented grade without derating the lamination stack. Procurement teams should treat country capacity figures as the gross envelope, then drill to specific asset level via the GIST dashboard [S5] before issuing RFQs.
Capacity cuts also propagate into steel mesh and steel fiber supply because both depend on cold-drawn wire rod drawn from the same hot-strip upstream. A 5.95 Mt central-SOE cut in crude steel [S3] translates within two to three quarters into tighter wire-rod allocation and longer mill lead times for concrete-reinforcement and shotcrete-fibre buyers.
Cross-Commodity Sourcing Context for 2026
Steel capacity does not move in isolation. Cobalt, nickel, rare-earth and copper inputs all gate specialty-steel output, and capacity-utilisation decisions at the mill level cascade back into those markets. For buyers running parallel RFQs across non-ferrous and ferrous inputs, the nickel alloy suppliers 2026 capacity map is a useful parallel read on stainless and superalloy availability, and the cobalt price trend piece tracks the battery-grade feedstock that increasingly competes with superalloy melt shops for the same hydroxide supply. [S1]
Adjacent mineral and metal coverage — including the rare earth oxide climb into July 2026 and the China rare-earth capacity map — matters because rare-earth additions to grain-oriented electrical steel and to high-strength automotive sheet sit on the same constrained allocation queues as permanent-magnet output.
Standards and Sourcing Discipline
Country capacity is a gross number; what ships against a purchase order is gated by mill certification. Buyers specifying alloy steel plate for pressure-equipment fabrication should pin the order to a specific standard (e.g. ASME or EN designation) rather than to country of melt, because the same nominal grade can carry different impact-test temperatures, grain-size controls and trace-element ceilings across the Chinese, Indian, Japanese, Korean and EU supplier base. [S2]
For wire-rod and steel fiber destined for concrete reinforcement, sourcing discipline means cross-checking the mill's quality manual against the project specification (yield strength, elongation, hook geometry for fibres) and against any country-of-origin tariff or anti-dumping measure active in the destination market. The 5.95 Mt central-SOE capacity reduction [S3] is a useful reminder that the gross capacity number can shift on policy notice, and that dual-source qualification remains the lowest-cost hedge.
Verifiable Trackable Signals
Two signals are worth watching into the second half of 2026. First, any update to the GIST tracker entries — the dashboard is live, and changes to plant status (operating, mothballed, retired, under construction) flow through with a date stamp that procurement can subscribe to [S5]. Second, quarterly crude-steel output releases from the national statistical agencies of China, India, Japan, the United States and the World Steel Association worldsteel short-range outlook — these releases move roughly 6-8 weeks after quarter close and are the cleanest read on whether the 3.7 billion-tonne global capacity base is being utilised above, at, or below the long-run trend.