
Robotic welding cell turnkey solutions are projected to climb from $7.41B in 2026 to $11.83B by 2030, a 12.4% CAGR, with the broader welding robotics market set to reach $19.9B by 2032 at a 10% CAGR [S1][S2]. Spot welding holds 26.4% of function-type share in 2025 and automotive end-use holds 40%, both figures that define where unit volume concentrates [S2].
Independent trackers converge: global industrial robot shipments are expected to grow from 549,555 units in 2025 to 761,303 by 2030, a 6.7% average annual rate, with welding the largest single application class [S3]. Across the seven public forecasts surveyed, the 2025 base market sits in a $6.58B-$10.2B band and the 2030-2035 endpoint ranges from $11.83B to $29.9B depending on whether cells, systems, or full line integration are counted [S1][S2][S4][S5][S7].
Market Size Across the 2026-2030 Window
The turnkey cell segment grew 12.6% from 2025 to 2026 alone, moving from $6.58B to $7.41B, and is contracted to compound at 12.4% through 2030 to land at $11.83B [S1]. IMARC's all-encompassing robotic welding scope values 2025 at $8.2B and projects $14.8B by 2034, while Persistence Market Research frames 2025-2032 as $10.2B to $19.9B at 10% CAGR [S2][S7]. Market.us extends the curve further: $9.7B in 2025 growing to $29.9B by 2035 at 11.9% CAGR, the most aggressive 10-year envelope of the seven [S5].
The variance is methodological, not directional. Cell-only turnkey excludes robot arms sold separately to end-of-arm tooling integrators, while full-line forecasts bundle fixtures, positioners, sensors, and software. A process engineer planning a 2027 capex line should anchor to the cell scope for budget (mid-single-digit-billion annual spend) and to the all-in scope when modelling supplier capacity. Welding equipment broadly, not just the robotic slice, is set to add $5,479.2M between 2026 and 2030 at 6.3% CAGR, indicating that non-robotic welding continues to expand in parallel [S6].
Regional Distribution and Where the Orders Land
Asia-Pacific was the largest regional market for turnkey cells in 2025, with North America the fastest-growing region through 2030 [S1]. For welding robotics broadly, Asia-Pacific is projected to hold 35% of 2025 share, lifting to 47.8% under the Market.us scope where arc-welding and medium-payload cells dominate [S2][S5].
This concentration maps directly to vehicle programs: China's Manufacturing 2025, Germany's Industry 4.0 framework, and the U.S. CHIPS and Science Act all channel public capital into smart-factory buildouts that pull welding robotics orders with them [S5]. For spec writers in Europe and North America, the practical consequence is that the bulk of reference cell designs, OEM reference architectures, and integrator capacity will continue to track APAC origin through 2030. Sourcing teams buying outside that region should expect 8-14 week longer lead times for the same cell configuration compared to a domestic APAC buyer.
Cell Type, Robot Type, and Payload Mix
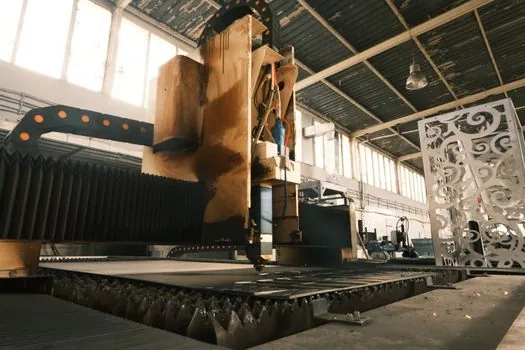
Arc welding cells lead the function-type split at 42.5% of 2025 robotic welding deployments, with spot welding cells second, followed by laser welding cells and other specialised configurations [S1][S5]. Across robot morphologies, articulated robots dominate the welding cell footprint, supplemented by SCARA, Cartesian/gantry, and a fast-growing collaborative robot (cobot) slice for high-mix work [S1].
Payload capacity tilts heavily medium: robots in the 51-150 kg bracket hold 45.6% of 2025 share, with the 6-22 kg low-payload and 80-300 kg high-payload bands filling the edges for thin-gauge electronics work and heavy structural fabrication respectively [S2][S5]. The reference cell for a Tier-1 automotive body shop therefore clusters around 6-axis articulated arms at 50-150 kg payload with a servo-driven positioner, while a job shop prototype cell drifts toward 6-22 kg cobot-class arms. Selection rule: pick the lowest payload that still meets the heaviest weldment plus a 25% margin, because inertia and reach errors scale worse than linearly above 150 kg.
End-Use Demand: Automotive, EV Battery, Heavy Fabrication
Automotive holds 40% of welding robotics demand under the Persistence scope and 48.7% under the Market.us scope, making it the single largest end-use in every forecast surveyed [S2][S5]. The shift to electric vehicle platforms is the underlying driver: bodies in mixed aluminium and advanced high-strength steel (AHSS) require parameter control tighter than manual welders can sustain at production rates, and the structural pack-to-body joining sequence in a modern EV pack adds several hundred weld points that did not exist on the equivalent ICE body.
EV battery and cell manufacturing is now an adjacent demand sink. Dry rooms for electrode coating, calendaring, stacking, and module pack assembly need seam-welded and laser-welded enclosures with very low heat input to avoid damaging cell chemistry, and collaborative robots are increasingly specified for module-top busbar welding where a fenceless cell shortens changeover between cell formats. Adjacent demand tracks across the EV value chain, with related capex pressure visible in the EV battery demand 2026-2030 outlook and the EV charger demand 2026-2030 buildout, both of which are pulling welding robotics into adjacent cleanroom and rack-assembly lines.
Productivity Justification: Arc-On Time and Cycle Numbers
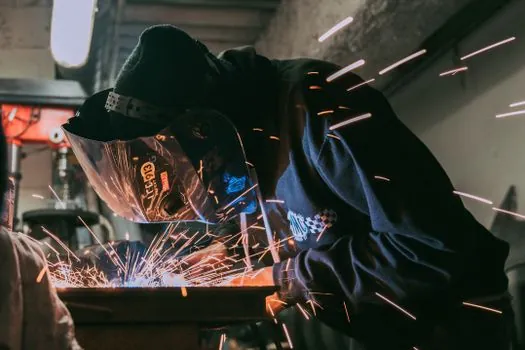
Robotic welding cells in fabrication environments run at 90-100% arc-on time versus roughly 30% for manual welding, the single largest productivity delta that justifies capital spend [S5]. At three-shift operation, a single robotic cell replaces three to four manual welders on raw throughput, before counting reject-rate and rework deltas. The 2025 University of North Dakota dissertation cited in the Market.us study found cobotic welding in high-mix, low-volume production cut cycle time 39% versus manual baselines, a meaningful data point for job shops that historically avoided automation because their batch sizes were too small.
Welding robot productivity scales with three engineering parameters: arc-on time, deposition rate (kg of wire laid per hour), and travel speed (mm/s) under valid procedure specifications. Push deposition rate past the process window for the chosen wire-gas combination and you trade travel speed for spatter and rework; the cell economics collapse quickly if the welding procedure specification (WPS) is not qualified to AWS D1.1, ISO 15614, or the equivalent body-in-white OEM standard before the cell is accepted. The 90-100% arc-on number is achievable only when the upstream blank presentation and downstream handling keep the cell fed, which is why turnkey cell designs increasingly bundle vision-guided seam tracking and adaptive process control rather than selling the robot arm as a standalone line item [S1].
Selection Criteria: When Robotic Welding Pays and When It Does Not
Robotic welding pays back fastest in three profiles: high-volume runs above 50,000 identical weldments per year, hazardous processes (stainless, hard-chrome-bearing alloys, lead-bearing surfaces) where manual exposure carries a regulatory premium, and tight-tolerance AHSS or aluminium work where parameter repeatability is non-negotiable. It does not pay in true one-off repair, in-field construction, or sub-100-unit runs of highly variable geometry unless cobotics is used, in which case the cobot-class arms in the 6-22 kg band become the rational pick over a fenced 150 kg articulated cell [S5].
A practical decision grid for a 2027 capex committee: choose a turnkey arc-welding cell with 50-150 kg articulated arm if annual volume exceeds 20,000 parts, geometry is stable, and weld length per part exceeds 200 mm; choose a cobot cell with seam tracking if volumes are 500-20,000 and part variety is high; choose a laser welding cell if the joint is a lap or seam in stainless or aluminium under 1.5 mm and cosmetic finish matters; choose a spot-welding cell only for body-in-white where the OEM has already specified the transformer and gun stack. The cobot option is a genuine expansion of the addressable market, but it does not displace the heavy articulated cell for primary structural work. For context on adjacent capital cycles, see how industrial pumps and related process equipment are tracking similar payback thresholds, and how welding cutting tool reference designs are converging on cell-ready formats. Reference cell architecture for industrial robots more broadly is moving toward IO-Link safety buses and OPC UA over TSN for fleet-level monitoring, and welding cells are the first application class to adopt that stack.
Limitations, Failure Modes, and Sourcing Risks

The largest single source of failed robotic welding deployments is not the robot, it is fixture and presentation variance. A cell that performs at 99% first-pass yield on a controlled sample will drop to 70-80% on a production shift if blank flatness varies by more than 1.5 mm across the seam length, and no amount of seam tracking compensates for a part that the positioner cannot repeat. Lead time for a turnkey cell runs 16-28 weeks in 2026, with the bottleneck at the welding power source and at the positioner rather than at the robot arm. [S5]
Skilled welder shortage is the demand-side accelerant: certified welders command premium wages globally, and the gap has widened in North America, Europe, and parts of Asia, which keeps robotic capex defensible even at higher interest rates [S5]. For sourcing teams, two failure modes to plan around: (1) welding power source firmware lock-in that prevents cross-brand torch and wire-feeder substitution, and (2) safety-rated bus latency above 8 ms that breaks collaborative-mode guarantees when a third-party positioner is added. The mitigation is to specify the safety bus and the OPC UA node map in the RFQ, not as a downstream integration task.
Signals to Track Through 2030
Two trackable signals will indicate whether the consensus 10-12% CAGR holds. First, quarterly automotive capex disclosure from the top ten global OEMs: a sustained decline in body-shop welding line announcements would compress the 2028-2030 forecast; conversely, a re-acceleration in EV pack welding capacity adds upside. Second, the arc-welding versus spot-welding mix in cells shipped, because spot-welding share above 30% in 2027-2028 would confirm EV body redesigns are pulling more spot capacity than the function-type mix currently anticipates [S2]. MarketsandMarkets' mid-range $22-26B 2030 estimate sits between the cell-only and all-in robotic welding scopes and is a useful midpoint for budget planning [S4].