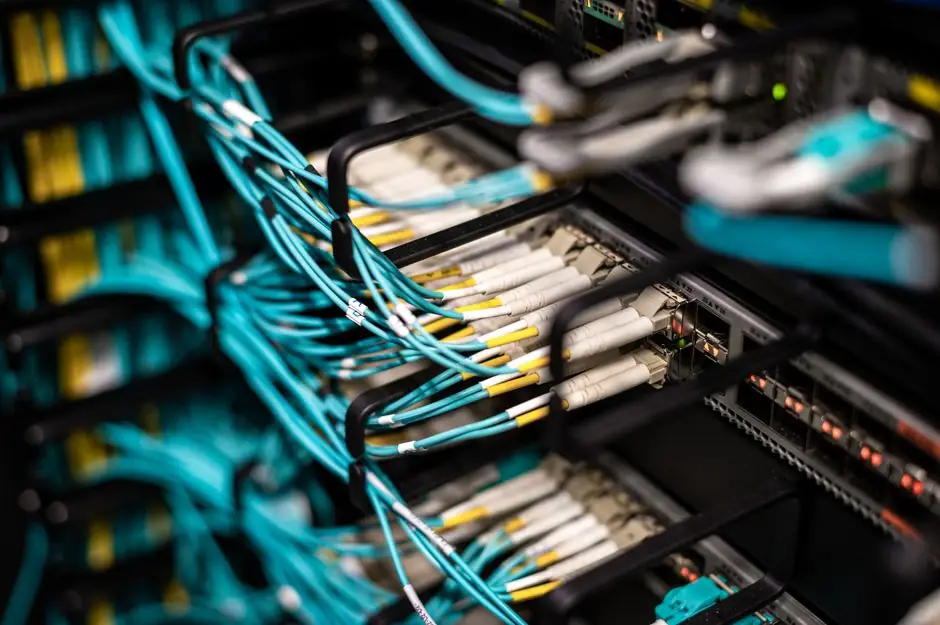
Building a data center in 2026 costs roughly $8M–$12M per megawatt for standard Tier II/III facilities and $15M–$20M+ per MW for AI-optimized campuses, with the global shell-and-core average at $11.3M per MW [S1].
Electrical systems account for 40–45% of that per-MW spend, cooling takes 15–25%, and Tier IV redundancy can lift total build cost by up to 40% versus Tier III, so the “power equipment” line item per MW of IT load is now the single largest discretionary budget block on a 2026 data center capex sheet [S1].
What the $8M–$20M+ per MW actually buys
Standard shell-and-core construction in 2026 averages $11.3M per MW globally, with hyperscale Tier IV facilities clustered at $12M–$15M per MW and AI-optimized campuses running $15M–$20M+ per MW because liquid cooling, higher rack densities, and direct-to-chip manifolds replace conventional air handling [S1]. At the gigawatt scale, AI campuses have been priced in the $45B–$55B per GW range, which is roughly 1.2–1.4× the per-MW cost of a Tier III colocation build of the same IT capacity [S1].
The per-MW envelope excludes land, IT servers, networking switches, and permitting; it is core-and-shell plus electrical and mechanical fit-out, which is where the power equipment sits. Cooling infrastructure on AI campuses has shifted from 15–25% of the budget toward the upper end of that range once rear-door heat exchangers, coolant distribution units, and chilled-water secondary loops are included [S1].
How electrical gear breaks the 40–45% budget slice
Within the 40–45% electrical allocation, the dominant equipment categories are medium-voltage switchgear, modular UPS blocks, lithium-ion battery rooms, busways, and PDUs sized to 30–100+ kW per rack on AI floors versus 5–15 kW per rack on legacy floors [S3]. Rack density is the variable that flips the equipment mix: AI racks at 50–100+ kW force 415/240 V three-phase busways, 60–100 kW per cabinet PDUs, and DC battery strings sized for shorter but steeper ride-through, which all cost more per MW than the 10–15 kW air-cooled era [S3].
For a 50 MW AI campus at the $20M per MW ceiling, $40M–$44M of that sits in the electrical line, and within that, switchgear, transformers, and modular UPS tend to consume roughly half while power distribution (busway, panelboards, PDUs), generator, and battery systems share the rest; this is the structure a spec engineer should track when validating a contractor bid [S1]. Procurement lead times for the same gear have stretched to 18–22 months on long-lead items, which is why 2026 owners are starting MV switchgear orders before civil work completes [S1].
Comparing the four facility types on power-equipment intensity
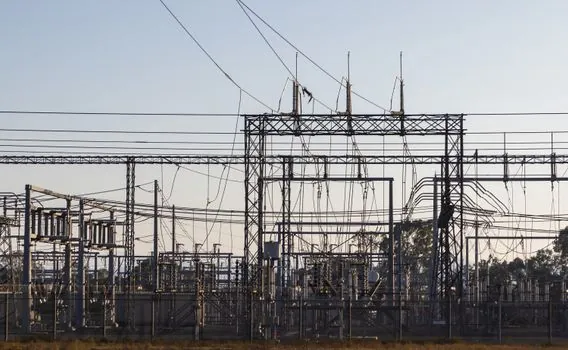
Side-by-side, Enterprise/Tier II runs $8M–$10M per MW, Colocation/Tier III runs $10M–$12M per MW, Hyperscale/Tier IV runs $12M–$15M per MW, and AI-Optimized runs $15M–$20M+ per MW, with AI floors costing 50–100% more per square foot than traditional builds because of the rack-power step-up from 5–15 kW to 30–100+ kW [S1][S3]. The electrical line as a share of capex stays in the 40–45% band across all four tiers, but the absolute dollars per MW of IT load nearly double between Tier II and AI-Optimized because the equipment itself is heavier-duty, not because margins are higher [S1].
For selection purposes, the decision tree on power equipment is: (a) confirm PUE and WUE targets, which fix the cooling-versus-electrical split; (b) confirm IT load profile (training vs inference, which sets UPS autonomy); (c) confirm tier (II/III/IV) to size redundancy N+1 versus 2N; and (d) confirm regional grid interconnect time, since three-plus-year interconnect queues are pushing 2026 buyers toward on-site generation as a budgeted line item rather than a contingency [S3].
Power demand and grid context that drive the spend
US data center power demand is projected to climb from 31 GW in 2025 to 41 GW in 2026 and 66 GW in 2027, with Goldman Sachs Research forecasting 92 GW by 2027 under a base case and 90 GW+ by 2030 in the AI scenario [S2][S6]. Globally, data centers consumed roughly 485 TWh in 2025, equivalent to an average continuous load of about 55 GW, and AI workloads alone are expected to grow from 14% of global data center power to 27% by 2027 [S4][S2].
Grid constraints are now the binding limit, not capital: wholesale electricity costs near US data center clusters have risen by 267% as AI demand landed faster than transmission upgrades, and grid interconnection delays of more than three years have made on-site generation a procurement deliverable rather than a future option [S3]. This is why 2026 capex sheets increasingly list gas turbines, fuel cells, and behind-the-meter solar as named line items inside the “electrical” bucket, blurring the boundary between utility-scale and on-site power equipment budgets [S3].
Limits, failure modes, and what the benchmarks do not cover
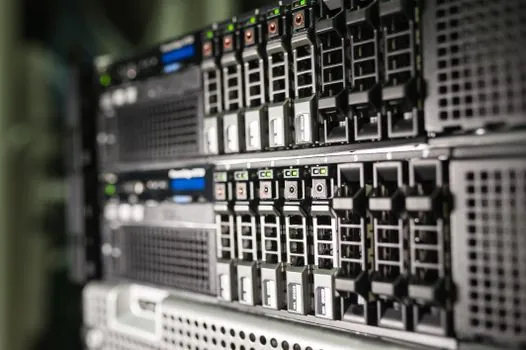
The $8M–$20M+ per MW band is a US-anchored benchmark, and regional cost variation can swing the per-MW figure by up to 40% between low-cost Midwest sites and tier-one coastal markets [S1]. It also excludes IT load itself, so the per-MW of “IT load” the user asks about is not the same as per-MW of utility capacity; a 50 MW AI campus at 1.4 PUE draws about 70 MW from the grid, which means the effective per-MW-of-grid-power is roughly 30% lower than the headline $20M figure.
Schedule risk is now the dominant failure mode: a 60 MW facility delay can run $14.2M per month, of which $10.8M is lost revenue, and the constraint is no longer civil or structural but transformer and switchgear lead times, which is why copper busbar sourcing for high-density racks and modular UPS procurement are starting 18–22 months ahead of energization in current 2026 plans [S1]. For owners comparing build economics against adjacent sectors, data center construction has overtaken office and retail spend in 2026, which is the macro signal that the per-MW benchmarks here are still moving upward rather than stabilizing.
Procurement signals worth tracking next
Track the McKinsey $6.7 trillion 2025–2030 global infrastructure figure and the Goldman Sachs 92 GW US-by-2027 forecast as the two anchor demand lines, and watch quarterly Tier IV and AI-Optimized per-MW print for whether $20M+ holds or slips toward $18M as modular electrical skids scale [S2][S3]. The cooling-side offset, documented in cooling tower lead times and two-tier market tactics, directly frees or absorbs electrical budget per MW, so any move in chilled-water versus liquid-to-chip ratio will show up in the 40–45% electrical share within two to three quarters.
Component reference pages worth checking: data logger, electronic load, and load cell.