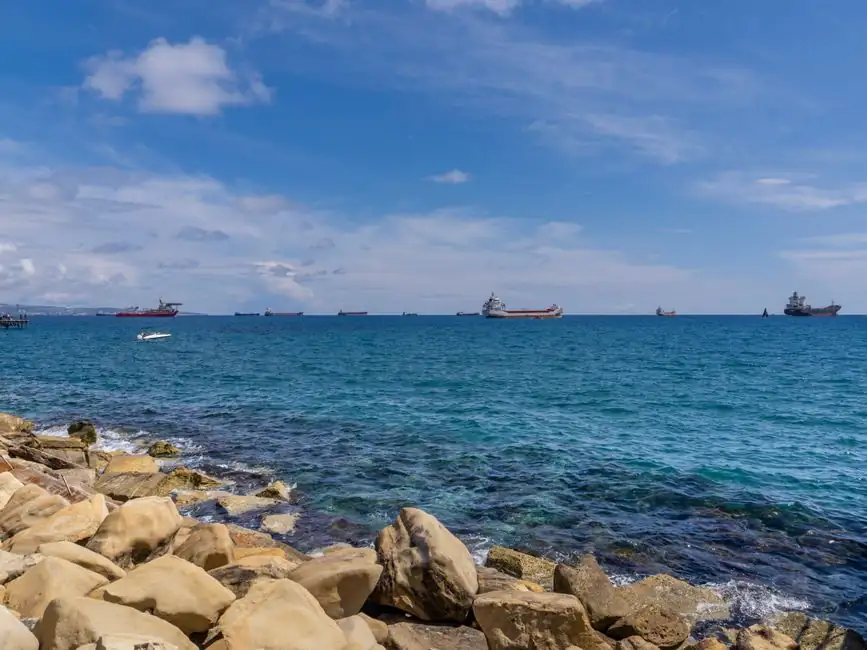
Global desalination capacity expanded roughly 40% between 2020 and 2025, and the 2026-2030 window is forecast to add another USD 11.27 billion in market value at an 8.9% CAGR on the back of water-stress capex [S1][S2].
Across geographies, membrane systems (RO, NF) keep eating share from thermal (MSF, MED) for new builds, while solar-powered and other renewable-coupled plants are now a measurable USD 4.58 billion sub-segment by 2030 [S5].
Market sizing: USD 11.27 billion added at 8.9% CAGR, 2025-2030
The headline Research and Markets forecast puts incremental 2025-2030 market value at USD 11.27 billion with an 8.9% CAGR, framed around three drivers: rising water scarcity, declining unit costs from tech advances, and rapid urbanization [S2].
Capacity is the harder number to ignore: Impax's 2026-08 note cites a ~40% expansion in global installed desalination capacity between 2020 and 2025, with sustained growth into 2030 [S1]. The same World Economic Forum figure cited by Yahoo Finance on 2026-03-20 puts global freshwater demand on track to overshoot supply by 40% by 2030, leaving an estimated 1.6 billion people in the gap [S3].
Inside the headline, the solar-powered slice is forecast to grow from USD 2.85 billion in 2024 to USD 4.58 billion by 2030, an 8.3% CAGR, with municipalities as the largest end-user group [S5]. For buyers sizing 2026-2032 capex, the 8.9% headline and the 8.3% solar slice bracket the realistic planning range.
Technology split: membrane dominant, thermal residual, solar accelerating
By technology the 2025-2030 split is membrane vs thermal, with seawater and brackish water as the two source buckets; by application the split is municipal, industrial, and others [S2].
Three growth vectors show up consistently in the research: integration of renewable energy into desalination trains, decentralized and modular systems for inland and remote sites, and brine management plus resource recovery (minerals, salt, gypsum) to offset disposal cost [S2]. The solar desalination sub-market maps directly onto the first vector, with the Middle East and Africa holding the largest regional share on the back of persistent freshwater depletion [S5].
Regional and source mix: MENA, APAC, and the brackish opportunity

Regional coverage in the Research and Markets taxonomy runs Middle East and Africa (UAE, Qatar, Oman), APAC (China, India, Australia, Singapore, Japan, South Korea), North America (US, Mexico, Canada), Europe (Spain, Italy, Greece, UK, France), and South America (Chile, Brazil, Peru) [S2].
For process engineers, that means intake brine chemistry and concentrate disposal routes are the binding design constraints on Gulf-region builds, not the membrane modules themselves.
For specifiers outside the Gulf, the brackish-water source bucket is where smaller, distributed, often containerized units compete on payback against pipeline extensions, and where the modular / decentralized thesis is doing real work [S2].
Application mix: municipal leads, industrial follows, reuse is the swing
Application segmentation is municipal, industrial, and others, and municipal is repeatedly the largest single end-user across both the headline market and the solar sub-segment [S2][S5].
Industrial demand is structurally two-tier: high-purity process water for power, petrochemicals, refining, and semiconductor fabs, and lower-purity cooling and boiler feed where reuse-grade treated wastewater is already acceptable. The World Bank 80%-to-100% reuse target for MENA by 2030 is the single clearest policy signal that industrial reuse is being actively substituted for incremental desalination in water-stressed basins [S4].
For procurement, that creates a definable 2026-2030 fork: greenfield municipal desalination (RO trains, large pumps, energy-recovery devices, pressure transmitter and flow meter skids) versus industrial reuse retrofits (UF/MF pretreatment, chemical dosing skids, automated industrial valve manifolds, PLC-controlled recovery loops). The same water stress is driving both, but the bill of materials is not the same.
Vendor landscape: 25 named EPCs and OEMs, RO membrane oligopoly
The Research and Markets 2025-2030 report covers roughly 25 vendors, naming Acciona, Aqua Filsep, Aquatech International, Biwater, Bluewater Desalination, Doosan Enerbility, DuPont, Fluid Equipment Development, Genesis Water Technologies, Hatenboer Water, IDE Water Technologies, Koch Industries, LG Water Solutions, Metito, Pure Aqua, Seven Seas Water Group, SUEZ, Toray Industries, Veolia, and Watermakers [S2].
The structural reality underneath that list is a thin RO membrane oligopoly (DuPont, Toray, LG, Koch/Sepro) feeding a much longer tail of EPCs, system integrators, and regional OEM skid builders. For buyers running multi-vendor qualification, the membrane replacement cycle and energy-recovery-device (ERD) retrofit decision are the two line items most exposed to price and lead time over 2026-2030.
Selection criteria and comparison frame for new builds
A practical comparison for a 2026-2030 desalination or reuse project lines up against four criteria: source water salinity (seawater vs brackish vs treated wastewater), energy coupling (grid vs solar PV vs hybrid), capacity class (municipal large-scale, industrial mid-scale, modular containerized), and brine strategy (deep-well injection, zero-liquid-discharge, mineral recovery). [S2]
On that frame, seawater + grid + municipal + deep-well is the legacy Gulf configuration and the bulk of installed base [S4]; brackish + solar + modular + evaporation ponds is the fast-growing inland and arid-region pattern [S5]; and industrial + hybrid PV-grid + mid-scale + ZLD or mineral recovery is where capex is accelerating where disposal regulations are tightening.
For instrumentation and controls specifiers, the consequence is a continued pull on pressure sensor density per train (high-pressure pump, ERD differential, inter-stage permeate), on PLC I/O for RO train sequencing and CIP, and on servo-motor actuated valves for automatic isolation and brine throttling, all of which scale with membrane area rather than permeate volume.
Limitations, failure modes, and what the forecast does not cover
The 40% capacity figure is described as an expansion of installed capacity, not a guarantee of utilization, and a 40% demand-supply gap by 2030 is a projected shortfall, not a contracted order book [S1][S3].
Real failure modes not addressed in the headline forecasts: membrane fouling and biofouling on high-recovery RO, brine density limits on ERDs, scale formation on thermal plants at higher top brine temperature, and grid-availability constraints on hybrid PV-desal designs. The solar 8.3% CAGR assumes the renewable-energy integration trend materializes as Research and Markets flags; it does not assume a specific PV capex trajectory [S2][S5].
Cross-link for context: the 2030 demand-supply shortfall framing mirrors the planning horizons used in adjacent infrastructure capex, including the build-out of data center cooling 2026 sizing and liquid cooling surge and the server hardware demand 2026-2030 three-market view, both of which are competing for the same power and water budget in coastal hyperscale clusters.