South Africa held roughly 27% of the global ferrochrome market in 2020, down from 39% in 2009, while China expanded from a marginal producer in 2002 to over 40% market share on output of 5 to 6 Mt per year against 3.6 Mt from South Africa [S3].
The ferroalloy itself demands smelting temperatures near 2,800°C, which sets a hard ceiling on how much sensor and control data a plant can carry before heat, dust, and induced currents swamp the acquisition layer [S2]. For buyers of pressure transmitter hardware on submerged-arc furnace (SAF) cooling panels, the spec is dictated by this environment, not by generic Industry 4.0 brochures.
Three-Phase Roadmap, With Full Digitalization Held Back
Letaba and Zulu (2021) framed a 30-year South African ferrochrome roadmap with three phases: stabilization via alternative energy, full-scale digitization, and sustainability. Full digitalization is explicitly deferred to phase 2, a deliberate sequencing because plants first need cheaper megawatts before they can justify dense instrumentation [S1].
The 2020 DTIC briefing accepts the same ordering: technology is listed as a South African advantage in chrome smelting, but the additional technology opportunities named are pre-heating, DC furnace, and processing of fines, all energy-side levers rather than data-side ones [S3]. In other words, the roadmap is process-first, data-second.
Why EAF Efficiency Numbers Get Quoted, and Why They Are Not IoT
The market research headline figure, a 12% production-efficiency gain from electric arc furnace (EAF) adoption, is a process and power-electronics win, not an Industry 4.0 outcome [S2]. Plant engineers should not bundle EAF efficiency with MES or digital-twin ROI when justifying capital.
Outokumpu's USD 45 million low-carbon ferrochrome pilot plant is a process-electricity play as well; the carbon-neutral pathway cited in the same report cut CO2 by up to 67% in 2025, which is electrode and energy-mix work, not a control-loop upgrade [S2]. A spec-first comparison therefore needs to separate the energy layer (furnace, electrode, pre-heat) from the information layer (sensors, PLC, historians).
What the Information Layer Actually Looks Like at a FeCr Plant
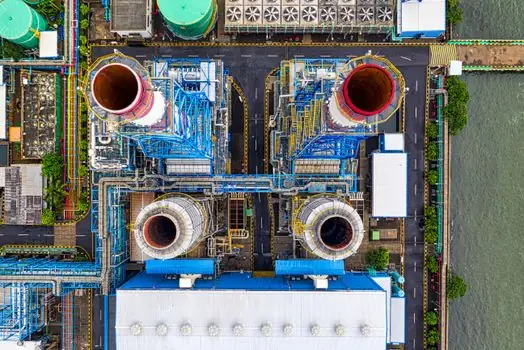
Real, shippable Industry 4.0 scope at a FeCr smelter is narrower than the marketing suggests: SAF electrode-current and resistance monitoring, burden-feed mass balance via weigh feeders, off-gas temperature and CO/CO2 analysis, tap-hole temperature, and slag-tempering industrial valve position feedback. Each of these maps to a discrete sensor or flow meter, not to a platform. [S2]
High-carbon FeCr is over 70% of global output, and the stainless-steel end market absorbed over 80% of FeCr production in 2024, with 50 Mt of stainless crude produced that year [S2]. At those volumes the average plant runs a few hundred analog loops, with digital upgrade limited to electrode regulation and a few safety-critical interlocks, exactly the conservative density that Letaba and Zulu (2021) cite as the reason phase 1 skips full digitalization [S1].
Resource Concentration Forces a Country-Specific Adoption Map
South Africa holds over 72% of global chrome reserves and produced 3.3 Mt out of 17.5 Mt world total in 2024, with non-integrated producers exporting 12.5 Mt/yr of ore, over 70% of it to China [S2][S3]. That export channel is the structural reason Chinese smelters, not South African ones, capture the digitalization learning curve first: they own the downstream stainless margin and can amortize pressure sensor and servo motor capex across captive furnaces.
Kazakhstan, Turkey, and India round out the major FeCr producers, all chromite-rich, all running SAF or DC arc technology, and all facing the same electrode and energy cost envelope [S2]. For these producers, the practical question is not whether to digitize, but at which sub-loop, and that decision is set by electricity tariff, not by software readiness.
Who This Roadmap Is For, and Who It Is Not For
The phased roadmap fits integrated producers with captive chrome ore, a captive or nearby stainless mill, and a national grid that prices peak power at a workable tariff. It does not fit merchant FeCr plants in jurisdictions with carbon-border tariffs coming in, or junior miners exporting raw ore, because they have no smelter to instrument [S1][S3].
A buyer comparing sub-loops for digitalization should score four criteria directly: (1) does the loop cut energy per MWh, (2) does it raise tap-to-tap consistency on grade, (3) does it survive 2,800°C radiant heat and MgO dust loading, and (4) does it feed a metric that finance already pays for, electrode kWh per ton FeCr. Loops that do not pass all four are roadmap decoration, not roadmap substance [S1][S2].
Trackable Signals for the Next 12 to 24 Months
Watch the Asia-Pacific share line, China, India, and Japan already take over 60% of global FeCr demand, and any 2026 published update on the next year's regional split will set the baseline for digitalization spend [S2]. Watch Outokumpu's pilot plant commissioning data, since USD 45 million of disclosed capex is the closest the industry has to a named Industry 4.0 reference site [S2]. Watch the South African DMRE-DTIC task team outputs, because the intervention that actually lands first-pre-heat or DC furnace retrofit will set the precedent for whether phase 1 of the Letaba and Zulu (2021) roadmap is treated as binding [S1][S3]. For related reference on adjacent selection work, see universal joint selection for steel mills and the broader sourcing map at power grid raw material sourcing guide: 2026 spec reference for copper, aluminium.