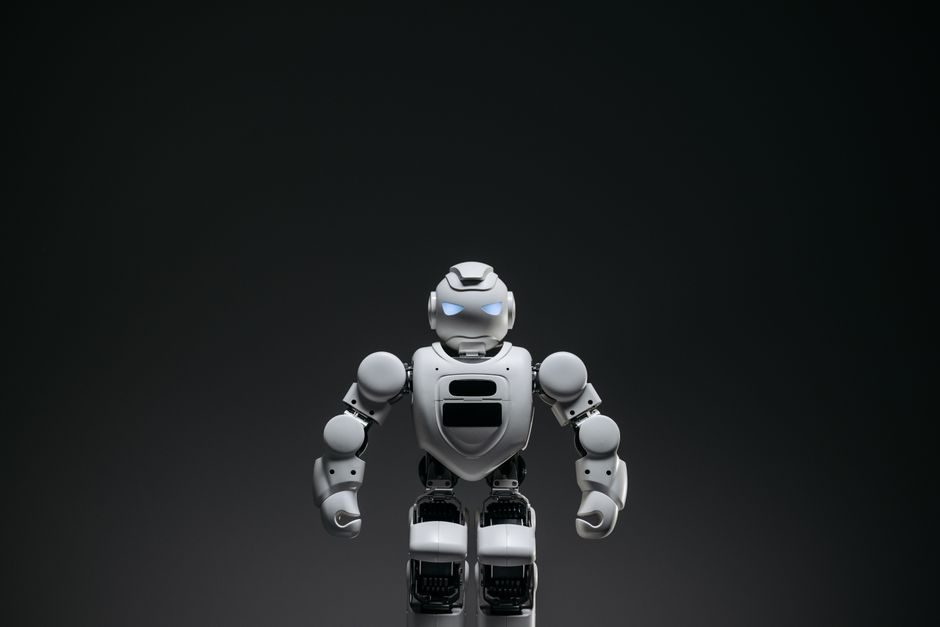
IndustryARC's Humanoid Robot Market Size Report, 2024-2030 projects the global market will reach $15.20 billion by 2030, expanding at a 50.2% compound annual growth rate across the 2025-2031 forecast window [S1]. The figure is anchored to biped motion platforms, hardware-plus-software stacks, and a top application mix that runs education, healthcare, research, and personal assistance in parallel [S1].
APAC is the leading regional bloc, with China, Japan, South Korea, India, and Australia forming the manufacturing core, followed by North America and a fast-closing Europe cluster that includes Germany, the UK, Italy, France, Spain, and Russia [S1]. Component segmentation is kept binary in the model — hardware and software — which matters for sourcing teams because motion control firmware, tactile-sensing middleware, and EDA-driven mechanical design are bundled into the software line rather than broken out as services [S1].
Biped vs Wheeled Drive: Selection Trade-Offs for Spec Setters
Biped motion is sized as the majority share through 2030 because BMT (bipedal motion type) platforms negotiate stairs, uneven floors, and obstacle fields that wheeled bases cannot [S1]. Wheeled-drive humanoids retain a defensible niche in flat-floor commercial settings, where energy per metre travelled, control-loop latency, and wheel wear dominate TCO over stair-climbing capability [S1]. For a related taxonomy on mobile bases that do not need a humanoid form, see the mobile robot category map covering AMR and AGV platforms — many warehouse pilots run a wheeled base rather than a full biped because the duty cycle does not justify the kinematic cost.
Selection rule of thumb from the report: specify biped only when the work envelope includes stairs, curbs, or human-scale obstacles; specify wheeled drive when the route is flat, repeatable, and throughput-bound, which is the same envelope that picks an AGV over a humanoid in most material-handling RFPs [S1]. Biped platforms carry roughly 20-40 actuators per unit depending on hand complexity, against 2-4 drive motors and a single steering actuator on a typical wheeled humanoid, and that order-of-magnitude actuator gap is the single biggest driver of price, MTBF, and service-contract sizing.
Application Stack: Healthcare, Education, and the 21% Anchor
Healthcare plus education held a combined 21% share of the humanoid robot market in the 2020 base year, and both are projected to remain the dominant application pair through 2030 [S1]. Inside healthcare the use cases are surgical assistance, disease management, pediatric support, and physical therapy; inside education the deployments are teaching assistants and play partners for children, which is fed by the rise of E-learning [S1]. The 21% number is the 2020 anchor — the 2030 split is not stated as a single percentage in the available excerpt, so downstream spec sheets should treat it as a directional floor, not a cap [S1].
For spec writers, the healthcare-plus-education overlap matters because it forces a single hardware chassis to clear both ISO 13482 (personal care robot safety) and child-interaction durability thresholds, which in turn drives sensor-fusion redundancy, force-limited joint architecture, and tactile-skin coverage as common requirements rather than options. A humanoid destined for the collaborative robot workspace inside a hospital corridor also has to satisfy the same power-and-force-limiting collaborative criteria that a stationary articulated robot cell would, just with a mobile base added.
Technology Stack: AI, Tactile Sensing, Visual Perception
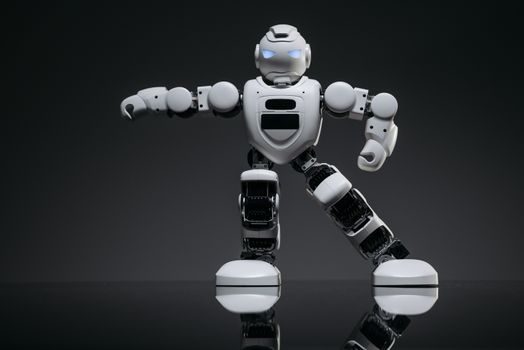
Reinforcement learning, tactile sensing, and visual perception are named as the three technology drivers that give humanoids their self-learning loop, and the report ties that loop directly to the 50.2% CAGR through 2030 [S1]. EDA (electronic design automation) is named alongside AI as an enabler for the mechanical and electronics co-design that biped platforms require, which is unusual in mainstream robotics forecasts and signals that the report treats hardware iteration as a first-class cost driver rather than a black box [S1].
For sourcing teams mapping 2026 supplier landscapes, the sensor side of that stack pulls in LiDAR, depth cameras, and force-torque skins that are also common on SCARA robot workcells, and the perception side is increasingly served by the same 3D-vendor ecosystem that the wider mobile-robot market uses. A spec-driven view of the LiDAR and depth-camera supplier map is consolidated in the Top LiDAR Sensor Companies 2026 spec map, which is a natural cross-reference for the perception side of a humanoid BOM.
Forecast Variables and What Could Break the 50.2% CAGR
The 50.2% CAGR is a top-line number, and three variables can move it in either direction: actuator supply (especially frameless torque motors and quasi-direct-drive reducers), battery energy density, and the cost of compute for onboard inference. Mobile battery demand is itself on a 5.2% CAGR through 2030, reaching $32.11 billion by 2030 from $24.9 billion in 2025 [S2], which is the kind of slow, predictable supply curve that humanoid ramp curves will have to ride rather than redirect — high enough to support scaling, low enough that humanoid uptake will not be the dominant demand sink for Li-ion cell output.
Exoskeleton and wearable robotics, which share actuator and battery supply chains with humanoids, are projected at a 14.5% CAGR from $694.4 million in 2026 to $1,790.0 million by 2033, with North America at 44.1% revenue share in 2025 [S3]. A 14.5% CAGR is well below the humanoid 50.2% figure, which is consistent with a market that is still in early-volume scaling rather than commoditised deployment. If humanoid volumes surprise on the upside, the actuator-and-battery supply chain will feel it first, and any squeeze will surface as price-per-DoF creep on biped platforms before it shows up in the headline revenue line.
Regional Sourcing Map: APAC Lead, North America Second
APAC's lead is structural rather than cyclical: the region hosts the major humanoid manufacturing countries (China, Japan, South Korea), and the report also flags rising deployment in education and healthcare as a regional accelerant [S1]. North America is the second-largest bloc, driven by US R&D depth and Canadian and Mexican integration into US-headquartered OEM supply chains. Europe is fragmented but technically dense, with Germany and the UK as the usual anchor markets for industrial-pilot deployments.
For a 2026 sourcing decision, the practical reading is: prototype and pilot in APAC for cost, qualify North American suppliers for safety-critical and healthcare-bound units where IEC 13482 and ISO 13849 documentation matter, and use Europe as the regulatory reference for collaborative-cell and human-robot-interaction certification work. The same dual-source logic shows up across adjacent power-and-thermal stacks, which is why the AI server supply shortage analysis for 2026 is a useful parallel read — humanoid onboard inference and AI-server training share HBM, CCL, and power-constraint bottlenecks, and the cure for one is partly the cure for the other.
What Specifiers Should Track From Here
Two trackable signals will tell you whether the 50.2% CAGR is holding: actuator price-per-Nm (which is the leading indicator for biped platform cost) and the volume of healthcare-bound humanoid units crossing ISO 13482 audit each quarter. A third signal — battery cell allocation announcements from the major Li-ion suppliers — will surface supply-chain stress before it reaches OEM list prices. These three numbers, tracked monthly, are a tighter early-warning system than the annual market-size revisions, and they will also be the first to expose any divergence between the report's $15.20 billion 2030 number and what actually ships. [S2]