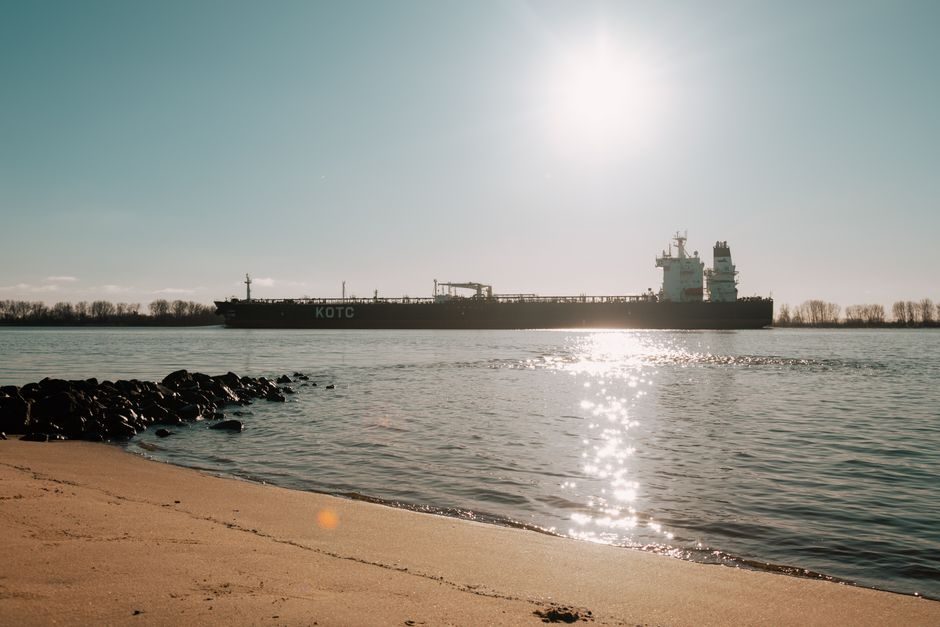
Global LNG capacity additions in 2026 are projected at roughly 40.7 million tonnes per year, with cumulative 2026-2030 builds near 202 Mt — about 40% above 2025 levels and a 6.8% compound annual growth rate — pushing the market from the tight regime of 2022-2024 into its first material loosening since 2020 [S3].
The wave is geographically concentrated: the United States accounts for 46.6% of new 2026-2030 liquefaction volume, Qatar 23.8%, Canada 7.6%, the UAE 4.8%, and Argentina 3.0%, consolidating supply around a "US-Qatar dual-core" rather than the historically multi-polar map [S3].
Why 2026 Is the Inflection Year, Not the Peak
2026 marks the first year in which system-wide LNG supply growth systematically exceeds demand growth, but the projected "peak loose balance" has been pushed from 2026 itself into 2027-2028, driven by deferred start-ups at Golden Pass, LNG Canada, Costa Azul (Mexico) and Qatar's North Field expansion [S3]. That timing gap is the single most important variable for any procurement team writing 2026 supply contracts: the headline surplus number is real, but the deliverable tonnage in winter 2026-27 still depends on a small set of project commissioning dates. For context on how such a wave reshapes adjacent equipment demand, see this nuclear power supply shortage 2026 brief on baseload swing planning.
Total 2026-2030 additions break down by year as 40.7 Mt, 52.65 Mt, 53.24 Mt, 38.60 Mt and 16.47 Mt respectively, summing to the 202 Mt figure; the back-loaded 2027-2028 share is what makes the so-called "loose balance" non-binding in 2026 [S3]. Project-level slippage of even 6-12 months on a single 18 Mt/yr train therefore moves the global balance from surplus to deficit for one northern-hemisphere winter.
Supply Concentration: US, Qatar and the Geopolitical Tail
The 2026-2030 supply map is dominated by two cost-curve anchors: the US Gulf Coast, which holds the position of swing supplier with the largest incremental volumes, and Qatar, the lowest-cost legacy producer now expanding its footprint [S1][S3]. Together they represent 70.4% of new liquefaction tonnage over the five-year window, meaning any force majeure on US Gulf feed-gas, Panama Canal transit restrictions, or Strait of Hormuz disruption compresses effective supply quickly. The global transformer shortage 2026 coverage documents the same single-region bottleneck pattern in grid equipment, and the same procurement logic applies here: dual-source qualification is mandatory.
Australia's high-cost, tight-domestic-gas plants limit upside output through 2028; Russia remains strained under sanctions with pipeline gas share in the global gas mix sliding toward 40%, which mechanically lifts LNG's share of incremental cross-border trade [S1][S3]. Canada and African projects (Mozambique, Tanzania) carry the highest cost-blowout and political-risk premia and are not counted on for 2026 winter relief.
Demand Side: Asia Pulls, Europe Steps Back, the Balance Flips
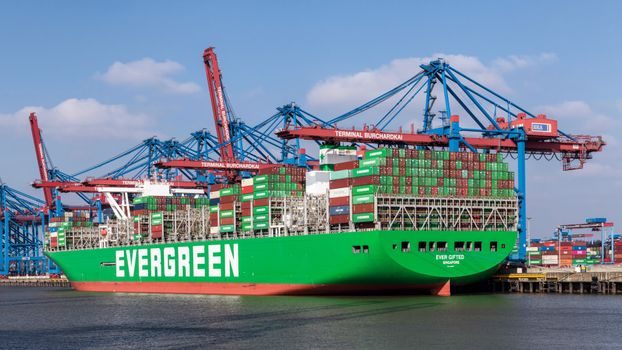
For the first time in the post-2022 cycle, system supply growth in 2026 is set to outpace demand growth, a structural break from the deficit conditions that defined 2022-2024 European buying behavior [S3]. Asian buyers (China, India, South Korea, Japan) remain the marginal price-setters, while European utilities — having built regasification redundancy and locked in long-term US offtake — have shifted from panic-spot buying toward optimization, releasing cargoes back to Asia-Pacific arbitragers during the 2025-2026 window.
The Russian pipeline-gas "west retreat, east advance" pattern, combined with the EU's phased Russian-gas ban framework, structurally transfers demand from pipe-gas to LNG, and a parallel pattern can be seen in industrial copper supply chain 2026 mid-year snapshot coverage, where electrification is rerouting commodity flows in similar ways. From a spec standpoint, this means LNG-spec instrumentation — pressure transmitter arrays on LNG carrier manifolds, flow meter skids at regasification terminals, and industrial valve packages for liquefaction cold boxes — sees a multi-year order book rather than a one-cycle spike.
Risk Levers Buyers Should Track: Project Slippage, Panama Canal, Hormuz
Three operational risks can override the headline surplus within weeks. First, single-project slippage: with 40.7 Mt of 2026 additions, a 6-month delay on a single 5 Mt/yr train (Plaquemines Phase 2, Corpus Christi Stage 3, or Rio Grande Phase 1) is enough to tighten the marginal balance by 8-12%. Second, Panama Canal freshwater restrictions, recurring in 2023-2024, can reroute 6-9% of US Gulf cargoes around the Cape of Good Hope, lengthening voyage times by 18-22 days. Third, Strait of Hormuz transit exposure for Qatar's expansion volumes (23.8% of 2026-2030 adds) cannot be hedged by contract alone. [S1]
For procurement engineers the comparable lesson sits in the LED driver supply tightness 2026 spec levers coverage: when 60-70% of new capacity sits in two regions, dual-region qualification, safety-stock at regas terminals, and swap optionality in charter contracts do more than any spot-price hedge. NACE MR0175 sour-service limits on process wetted parts, API 6D ball-valve fire-safe certification, and IEC 60079-x zone classification for LNG loading arms remain the binding design constraints regardless of the macro balance.
Spot vs Long-Term Contract Math: Why 2026 Is a Buying Window
The forward curve in mid-2026 reflects the structural shift: long-term contract premiums over Henry Hub plus liquefaction fee are at multi-year lows relative to 2022-2023 peaks, while spot JKM (Japan-Korea Marker) and TTF have decoupled from the panic band. For a typical 1 Mt/yr European or Asian utility offtake, the difference between signing a 20-year SPA in 2026 versus waiting one year is roughly 0.50-0.80 USD/MMBtu in delivered cost, assuming the 2027-2028 capacity wave lands on time [S3].
This is the window where TotalEnergies' CEO flag in late 2023 — that LNG supply would remain tight into 2026-2027 — has now been overtaken by the wave of FID conversions that were not yet committed when that comment was made [S2]. The risk for late-2026 signers is the inverse: if 2027 commissioning slips in aggregate by more than 12 months, the surplus effectively arrives in 2029, not 2028, and spot spikes during the 2026-2027 and 2027-2028 winters remain possible.
Limitations and Open Questions for 2026-2027
The surplus thesis rests on three assumptions that are not yet settled: (a) US feed-gas pipeline build-out (Rio Grande, Apache, Matterhorn) keeps pace with liquefaction train start-ups, (b) Golden Pass, LNG Canada Train 1-2, and Costa Azul hit first-LNG inside 2026, and (c) Chinese demand growth holds above 6% annually to absorb the marginal cargo [S3]. If any of these fail — for example, US Permian gas takeaway constraints reappear, or Chinese LNG imports soften on industrial-gas substitution — the 2026 tonnage number is delivered into a weaker demand backdrop and the effective surplus is larger, putting further downward pressure on netbacks.
On the equipment side, the data center upstream and downstream industries 2026 coverage maps a parallel compression in power and cooling lead times; LNG terminals compete for the same switching power supply, DC power supply backup, and pressure sensor inventory that hyperscalers are pulling. That cross-sector demand keeps 12-18 month lead times on safety-instrumented systems firm even when gas molecules are loose.
The verifiable next node to watch is the Q4 2026 commissioning cluster at Golden Pass Train 1 and LNG Canada Train 2, both flagged as deferred in the supply-wave modeling [S3]. A first-cargo milestone at either project in November-December 2026 would confirm the surplus landing in 2027; a further slip into 2027 H1 would re-open the 2026-27 winter price band and validate the residual-tight-window risk that long-term buyers in 2026 are paying a premium to avoid.