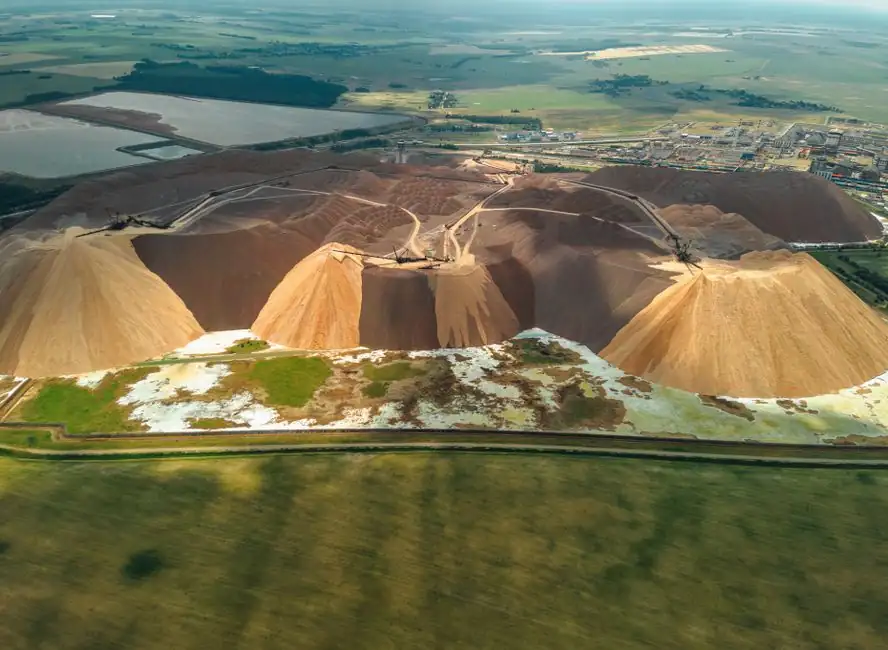
China accounted for 60% of global mined production of magnet rare earths in 2024 and retains control of more than 80% of refining capacity, anchoring the supply side of a market sized at USD 4.13 billion in 2025 [S3][S4].
Asia Pacific captured 87% of 2025 rare earth metals market revenue, while neodymium held the largest share by element type and magnets dominated by application [S4]. The global market is forecast to reach USD 10.83 billion by 2035 at a 10.12% CAGR, driven by EV traction motors, wind turbine generators, and AI data-center hardware [S4].
Where the Supply Concentrates: Mining and Refining Split
China's share of mined magnet rare earths reached 60% of global output in 2024, with Myanmar, Australia, and the United States ranking as the next-largest producing countries [S3][S10]. Refining is more concentrated: Chinese processors handle over 80% of global separation throughput, a structural chokepoint that downstream magnet makers and motor OEMs are now actively hedging [S4].
Within the element mix, rare earth permanent magnet (REPM) materials, principally NdPr oxide and Dy/Tb additives, accounted for 96% of end-use market share, while cerium and lanthanum sat at roughly 2% combined as catalyst and glass-polishing byproducts [S7]. That ratio matters for spec writers: REPM pricing is the index that drives magnet and motor cost models, not the bulk cerium market. Broader market sizing tracks a parallel track, with one forecaster sizing the rare earths value chain at USD 3.95 billion in 2024 expanding to USD 6.28 billion by 2030 at 8.6% CAGR [S5].
Top Manufacturers and How Their Positions Differ
The named top-tier players across the supply chain include Aluminum Corporation of China (Chinalco), China Minmetals, Lynas Rare Earths, Iluka Resources, and MP Materials, with Rare Element Resources and Energy Fuels listed among the Western contenders [S9]. Lynas operates the Mt Weld concentrate facility in Western Australia plus the Kalgoorlie cracking and separation plant, the only commercial-scale non-Chinese separation line shipping mixed rare earth carbonate today [S8].
MP Materials runs Mountain Pass in California, historically a concentrate producer that is now building out domestic separation and NdFeB magnet alloy capacity under DoD-supported offtake. Energy Fuels processes monazite sands through its White Mesa mill in Utah, recovering rare earths as a byproduct of uranium processing, a route that bypasses the bastnasite-monazite split that defines Chinese output. Iluka retains a different model, holding a fully integrated rare earth refinery under construction in Eneabba, Western Australia, designed to feed monazite from mineral sands operations. Each of these Western projects targets the same downstream bottleneck: the 80% Chinese refining share [S3][S4].
Application Pull: Magnets, Batteries, and the AI Data-Center Spillover

By application, magnets dominated the global rare earth metals market in 2025, with the battery segment projected to show the fastest growth through the forecast window [S4]. EV traction motors consume roughly 1-2 kg of NdFeB magnet per vehicle, with dysprosium and terbium added for high-temperature demagnetization resistance, which is why Dy and Tb pricing decouples from the broader basket.
AI infrastructure is now a second-order demand driver: predictive analytics tools are being deployed to identify new rare earth deposits and to predict equipment failures in separation circuits, lowering opex per kilogram of separated oxide [S4]. Rio Tinto announced an AI-driven exploration integration in January 2023, and the same analytical stack is being repurposed for grade control in clay-hosted ion-adsorption deposits, the type that supplies the heavy rare earths (Dy, Tb) which China mines predominantly in the south [S4]. The EV magnet demand story connects directly to lithium battery competitive landscape supply chains, and the broader industrial commodities cycle sits alongside adjacent material spec coverage in this industrial fasteners 2026 engineered grades piece.
Comparison: Chinese Integrated vs Western Single-Asset vs Mineral-Sands Byproduct
Procurement teams evaluating offtake should weight four criteria. On cost, Chinese integrated players (Chinalco, China Northern Rare Earth, China Minmetals) remain cheapest at roughly 60-80% of Western equivalent prices owing to scale, cluster co-location, and lower environmental compliance overhead [S3][S6]. On supply security, Western single-asset producers (Lynas, MP Materials) score higher because contracts are signed under non-Chinese legal jurisdiction and avoid export licensing risk, which the Chinese government tightened in 2024-2025 [S3].
On element coverage, mineral-sands byproduct routes (Iluka, Energy Fuels) deliver a full heavy-rare-earth basket including Dy and Tb, while bastnasite single-asset producers such as Mountain Pass historically skewed light rare earth (La, Ce, NdPr) until separation commissioning matures. On ESG and traceability, Western producers carry auditable radioactive-material handling protocols for naturally occurring thorium and uranium in monazite feedstock, a different compliance envelope than bastnasite. The silicone rubber market 2026 HTV vs LSR spread coverage illustrates the same parallel risk: spec-grade materials carry a diversification premium.
Limit Specifiers Should Price Into Contracts
Three constraints matter for any 2026 offtake decision. First, oxide-to-metal conversion capacity is itself concentrated: even non-Chinese separated oxide must typically ship to Japan or Estonia for NdFeB alloy strip casting, a step that reintroduces geographic dependency [S8]. Second, heavy rare earths (Dy, Tb) remain the price-volatile leg, with single-month moves of 20-40% historically tied to Chinese export quota announcements; contracts should specify maximum quarterly price collars rather than annual fixed price [S7].
Third, recycling is technically proven at scale: Hitachi Metals and several Chinese recyclers recover Nd from end-of-life magnets and magnet swarf, but recycled Nd supply covers under 5% of global Nd demand today, so it functions as a hedge layer, not a primary source. Spec anchors for adjacent industrial materials, including industrial catalysts 2026 heterogeneous share and industrial filtration 2026 sizing, are seeing the same Asia-Pacific concentration pattern play out in their own value chains.
Standards, Sourcing, and the USGS Reference Floor
The U.S. Geological Survey National Minerals Information Center publishes annual production, reserve, and price data for scandium, yttrium, and the 15 lanthanide elements grouped as rare earths; this is the default reference for any independent market-share figure cited in a sourcing dossier [S1]. USGS reserve tables also break out individual oxide pricing (oxide of Nd, Dy, Tb, etc.), which downstream motor designers need for bill-of-materials sensitivity work.
Several different market research houses publish divergent top-line values, and the spread is itself informative: one forecaster pegs 2025 revenue at USD 4.13 billion rising to USD 10.83 billion by 2035 at 10.12% CAGR [S4], while another tracks USD 3.95 billion in 2024 reaching USD 6.28 billion by 2030 at 8.6% CAGR [S5], and a third sizes 2025 at USD 4.12 billion reaching USD 9.89 billion by 2034 [S2]. The variance stems from where each report draws the value-chain boundary, mine gate versus separated oxide versus metal and alloy. Spec writers should pin the definition before benchmarking price [S2][S4][S5].
Trackable next signals: quarterly Lynas NdPr production volume (the cleanest read on non-Chinese separation throughput), the MP Materials Mountain Pass separation commissioning milestone, and the Iluka Eneabba refinery first-feed date, each of which moves the 60% / 80% concentration figures cited above.
Spec-level background on the components involved: earth ground tester, pressure transmitter, and flow meter.