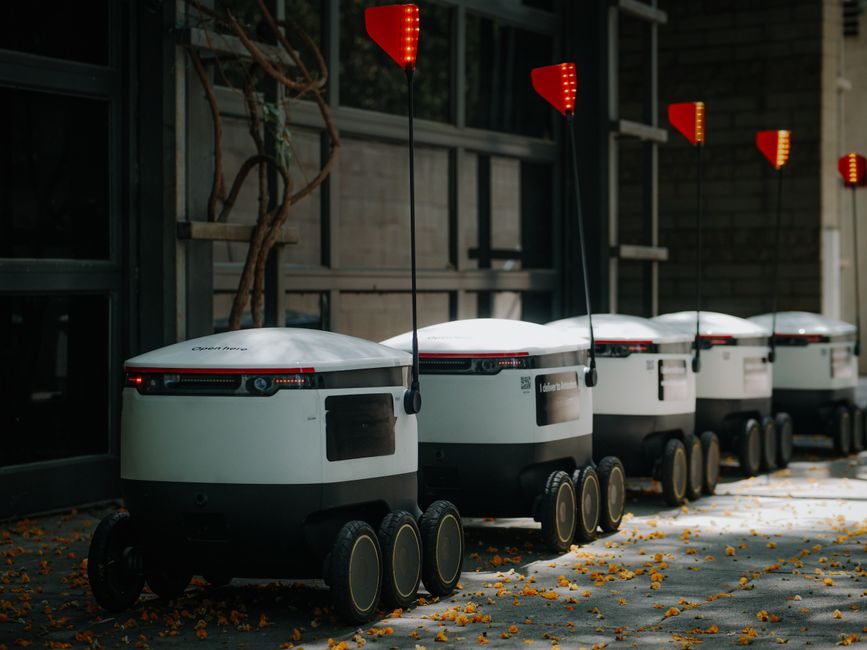
An Autonomous Mobile Robot (AMR) is a self-navigating wheeled platform that plans its own path using onboard sensors and SLAM, unlike an AGV robot which follows fixed guidance infrastructure [S2]. The global AMR market is projected to reach USD 14.40 billion by 2030 at a 21.4% CAGR (2023-2030), with Asia-Pacific growing fastest at 22.6% CAGR [S3].
Total Cost of Ownership (TCO) covers purchase, use, maintenance, support and disposal over the full lifecycle, exposing costs that are typically hidden in upfront budget planning [S1]. For AMRs, TCO is dominated by integration, energy and uptime-sensitive spares — not by the unit's sticker price.
Five Cost Lines That Drive AMR Lifecycle Spend
The first cost line is the vehicle itself: AMR units in commercial intralogistics deployments typically carry 50-1500 kg payloads, with goods-to-person picking robots, self-driving forklifts, autonomous inventory robots and tugging units covering the bulk of new sales [S3]. Unit prices vary widely by payload, safety scanner count, battery capacity and lift mechanism; per-vehicle hardware is the smallest TCO line in a multi-year fleet deployment.
The second cost line is fleet software and traffic control: a Warehouse Execution System (WES) or fleet manager license, charged per robot or per site, plus the cost of mapping, mission templates and ongoing SLAM re-tunings as the warehouse layout shifts. The third cost line — integration with conveyors, WMS, ERP and door/elevator controls — frequently equals or exceeds the hardware line on a greenfield site, driven by PLC tag counts, OPC-UA or REST API work, and safety zoning per ISO 3691-4.
The fourth and fifth lines — energy (battery + charging) and maintenance (sensors, wheels, drive gearboxes, lift masts) — are the long tail. Battery cycles, scanner window replacements and tire wear all scale with duty cycle, which is why the TCO conversation almost always lands on uptime, throughput and energy per mission rather than on purchase order value [S2].
Where the Money Actually Goes: Capital vs Operating Split
Across published AMR commercial models, capital expenditure (CapEx) — the vehicle, fleet software and integration — typically represents 40-55% of a 7-10 year TCO, with operating expenditure (OpEx) — energy, maintenance, spares, software subscriptions and operator labour — making up the remaining 45-60% [S1][S2]. In contrast, an articulated robot cell is much more capital-heavy (often 70-80% of lifecycle cost) because tooling, jigs and fixturing dwarf the energy bill.
The two largest OpEx drivers are battery degradation and unplanned downtime. Lithium chemistries used in modern AMRs lose usable capacity over 1500-3000 full equivalent cycles, so a 24/7 fleet typically budgets one battery refurbishment per vehicle inside a 7-year window. Downtime is dominated by safety-scanner contamination, wheel and drive-roller wear, and lift-mast cable fatigue on goods-to-person units; each unscheduled hour in a 100-robot fleet can outweigh the per-unit hardware saving between two competing bids.
Who AMR TCO Is For — and Who Should Walk Away

AMR TCO analysis pays off for operations running three shifts, handling repeatable pick/transport tasks over distances of 20-200 m per mission, with mixed-SKU inventory that defeats fixed-path automation [S2][S3]. Warehousing, e-commerce, automotive assembly, healthcare medication delivery and cross-dock terminals all fit this profile — the same segments that the AMR market report identifies as primary end-uses [S3].
AMR TCO is a poor fit for low-mix/high-volume conveyor-replacement work where a fixed AGV robot line still wins on unit-cost-per-pallet, for very small fleets (under five vehicles) where integration and software amortisation dominate, and for any site with highly variable, non-standard floor conditions that block reliable SLAM operation. If your operation cannot guarantee mapped aisles, controlled lighting and reasonable floor flatness, the maintenance line will balloon regardless of vendor choice.
Decision Criteria: Comparing AMR, AGV and AMR-Cobot Hybrids
A criteria-based comparison clarifies the call. On unit cost per vehicle, AGVs are typically lower (no onboard compute, simpler safety), while AMRs carry a premium for SLAM, lidar and onboard fleet negotiation; a collaborative robot arm mounted on an AMR base sits at the top of the cost stack but adds manipulation, not just transport. On flexibility, the order inverts: AGVs are rigid (re-tape = change capex), AMRs are highly flexible (re-map = hours of effort), and AMR-cobots add SKU-level dexterity. On integration cost, AGV is highest when paths change often, AMR lowest for dynamic layouts. [S3]
On uptime, modern commercial AMRs target 95-99% in controlled environments, but the mobile crane-style "rugged outdoor" category of large-payload AMRs (yard trucks, container handlers) sits lower because of weather and tire wear. The decision rule that senior engineers use: if your layout changes more than twice a year, AMR wins on TCO within 18-24 months; if not, AGV still wins on hardware unit cost.
Total Cost of Ownership Levers You Can Pull in 2026
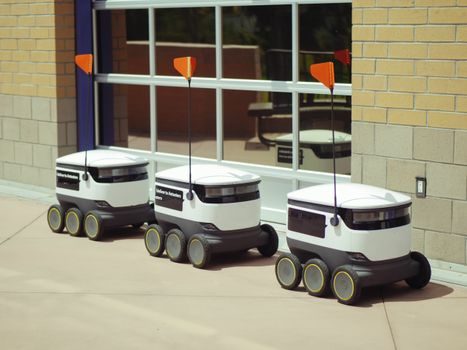
The second is charging strategy: opportunity charging at low SoC thresholds during micro-pauses beats full-cycle deep charging for cycle life, but requires more chargers and dock space. The third is software subscription vs perpetual licensing: a 5-year SaaS commitment can lower initial cash outlay by 20-30% but raises the 10-year total by a comparable percentage if usage extends. [S1]
The fifth is decommissioning: lithium battery recycling and data-wiping at end of life are now line items in EU-regulated sites, not free returns. Buyers who model these five levers explicitly — rather than negotiating unit price alone — end up with the TCO figure that matches the field, not the spreadsheet [S1][S2].
Limits, Failure Modes and Sourcing Signals
The single biggest TCO failure mode is integration over-run: a 30-robot fleet whose go-live slips from 12 weeks to 30 weeks burns roughly 6-9 months of expected OpEx savings in delay costs alone. The second is mis-sized fleet: too few robots creates a queue that erodes the labour-savings thesis; too many robots idles the fleet and inflates maintenance-per-mission. The third is the SLAM re-mapping cost of a brownfield expansion — every aisle change costs labour hours that the original TCO model rarely carries. [S1]
Trackable signals for the next 6-12 months: AMR-vendor 2026 financial filings (revenue growth vs gross margin compression), DHL-class logistics rollouts expanding past the USD 150 million Australian deployment baseline cited in the AMR market report [S3], and the second wave of Asia-Pacific e-commerce AMR contracts closing in 2026 H2. Buyers should also watch the IEC 60204-1 and ISO 3691-4 compliance audit trend in the EU, which is tightening safety-scanner redundancy and pushing some legacy AGV retrofits into full AMR replacement — a tailwind for new unit sales and a one-time cost line for incumbents [S2][S3].
For a parallel lifecycle-cost case on heavy plant, see this steel pipe TCO breakdown across five cost lines and three service tiers, and for the heavy-equipment side of the same question, the skid steer TCO analysis on engine, DPF and hydraulics is a useful counterweight. On the materials side, a silicon steel TCO review of core loss and stamping yield shows how the same five-line discipline transfers to electrical steel procurement.